Monitor Individual Learner Progress with JumpLMS Learner Reports
JumpLMS Learner Reports give you a complete picture of how individuals are progressing through their assigned courses. Whether you're reviewing performance, preparing for a one-on-one, or analysing learner behaviour, our reports provide the data you need - all in one place.


Learner Overview
Get a snapshot of each learner’s overall activity in the platform. The overview includes:
- Total number of assigned courses
- Number of completed courses
- Total training time logged
- Login count
- First and most recent login dates
- Completion dates
- Course engagement levels
Use this section to quickly identify how active and consistent a learner has been across your training programmes.
Course-Level Breakdown
See detailed progress for each course assigned to the learner, displayed in an intuitive, filterable table. For each course, you can view:
- A real-time progress bar
- Completion status
- Time spent in the course
- Number of course accesses
- Points earned
- Completion dates
Perfect for understanding which learners are on track and who may need additional support.
Drill Deeper with Course Reports
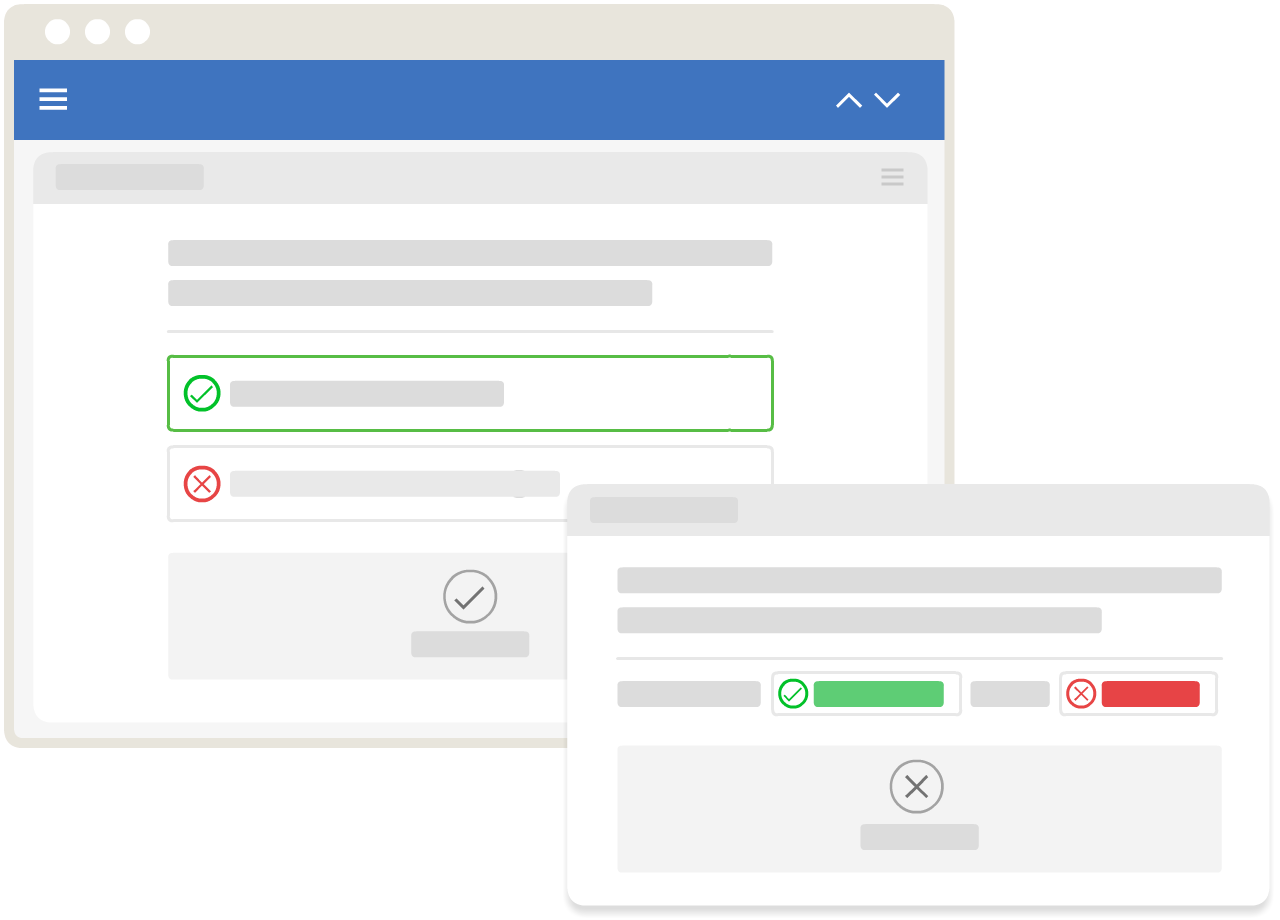
For a more in-depth look, open a Course Report from within the learner profile. This reveals:
- Progress through each course content element
- Test results with question-by-question breakdowns
- Survey responses
- Time spent on individual course components
All reports are presented in easy-to-read graphs, tables, and visuals that make interpretation fast and actionable.
Learner Timeline
Every action a learner takes on the platform is logged in the Learner Timeline.
Filter timeline data by:
- Activity type (e.g. course access, test completed)
- Specific courses
- Date ranges
Use this view to track learning habits, identify gaps, and build a full picture of each learner’s journey.