JumpLMS Reporting Tools – Track Learner Progress & Course Analytics


Reports Overview
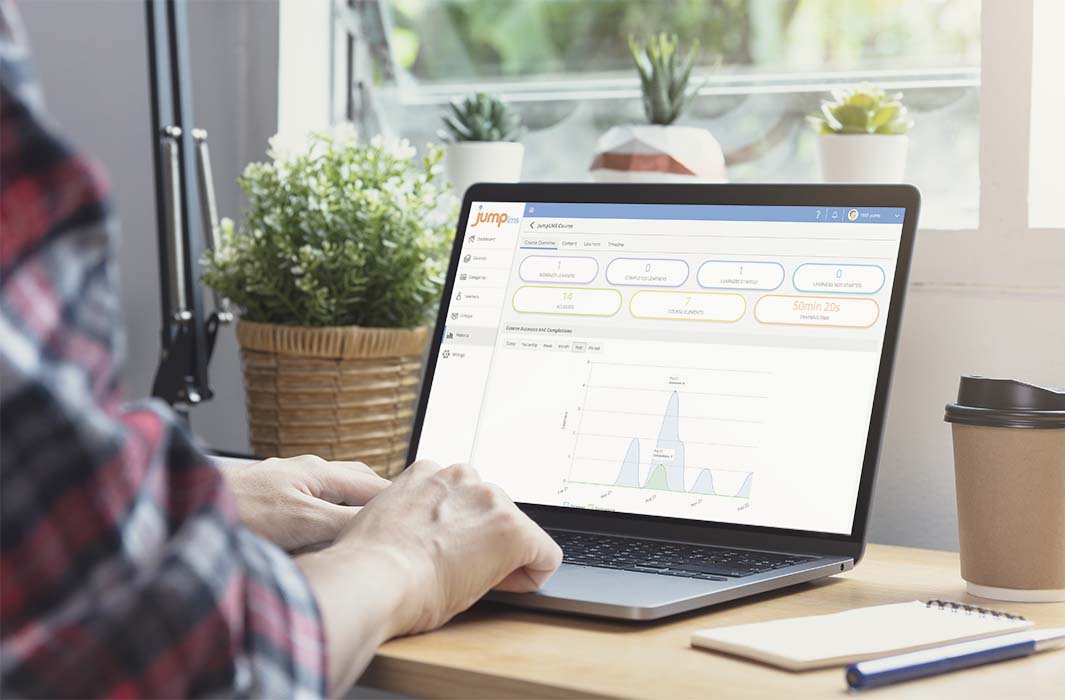
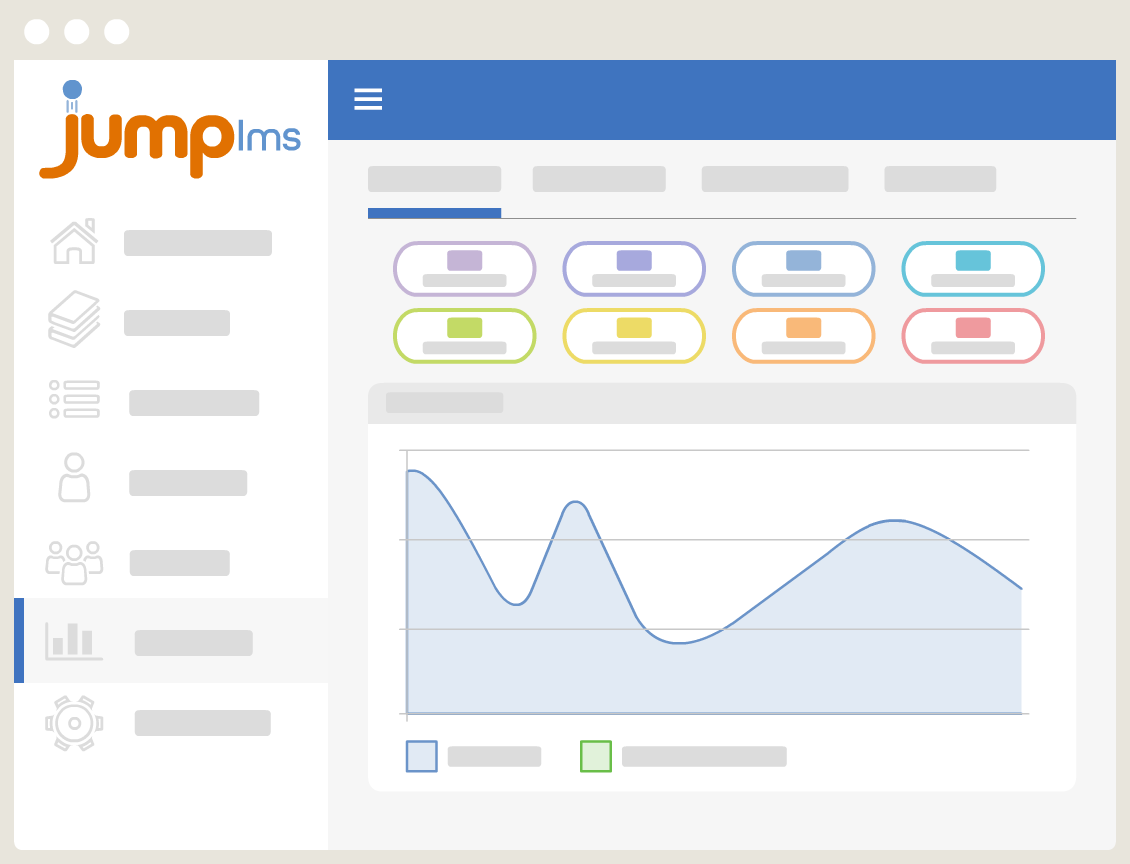
Start with a high-level visual snapshot of your entire portal.
The Reports Overview dashboard displays interactive graphs and charts showing:
- Login frequency
- Course completions
- Course engagement trends
- Most popular courses
Use custom date filters to drill into the exact data you need, whether for internal reviews, compliance audits, or learner progress check-ins.

Course Reports
For every course you publish in JumpLMS, you gain access to detailed analytics:
Courses Summary
View course-level performance metrics including:
- Assigned learners
- Access counts
- Completion totals
Course Overview
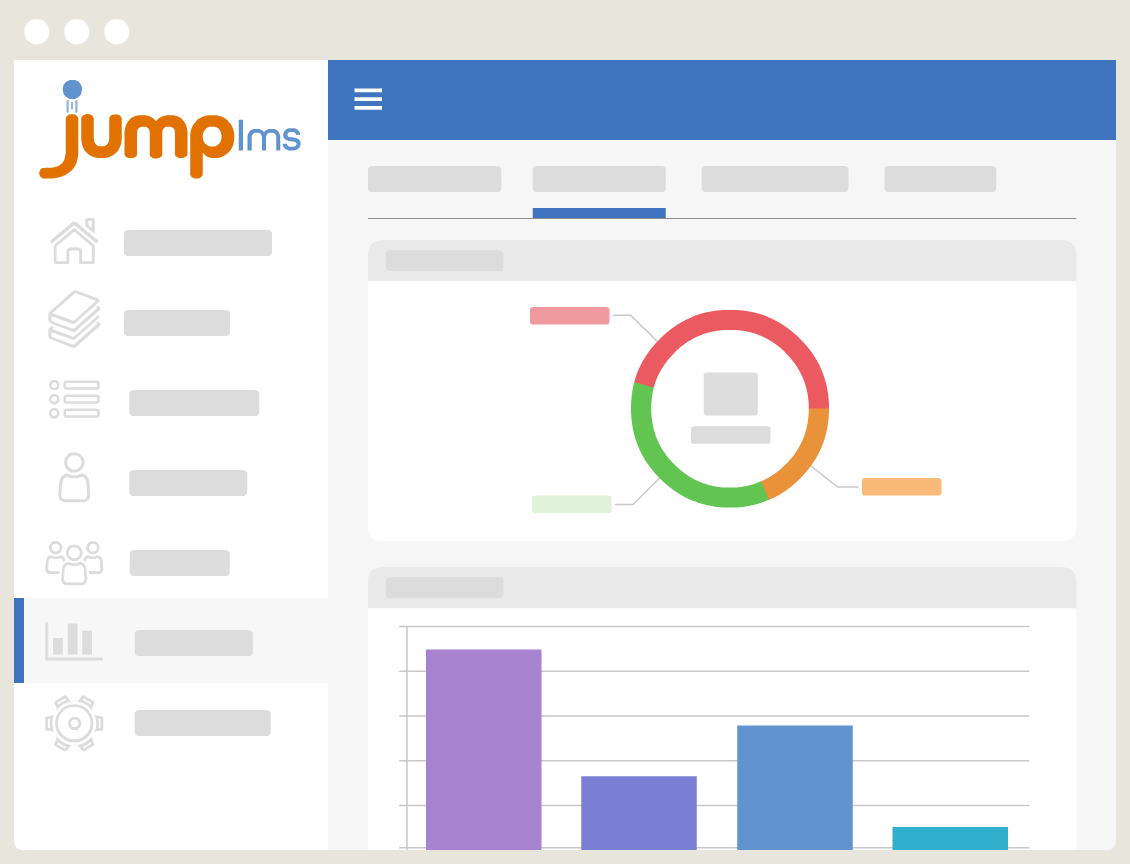
Get a visual look at overall engagement using pie charts, graphs, and learner activity timelines.
Course Content Analytics
See how each element in your course is performing. Identify which content is most visited, how long learners spend on each element, and where they drop off.
Test & Survey Reports
Review detailed results from built-in quizzes and surveys:
- Track learner scores and answers
- Identify question-level insights
- Spot trends in common responses
Course Timeline
See a chronological view of learner activity across each course, from first login to final completion.


Learner Reports
Every learner has their own performance data profile. JumpLMS makes it easy to analyse both individual and group performance:

Learner Summary
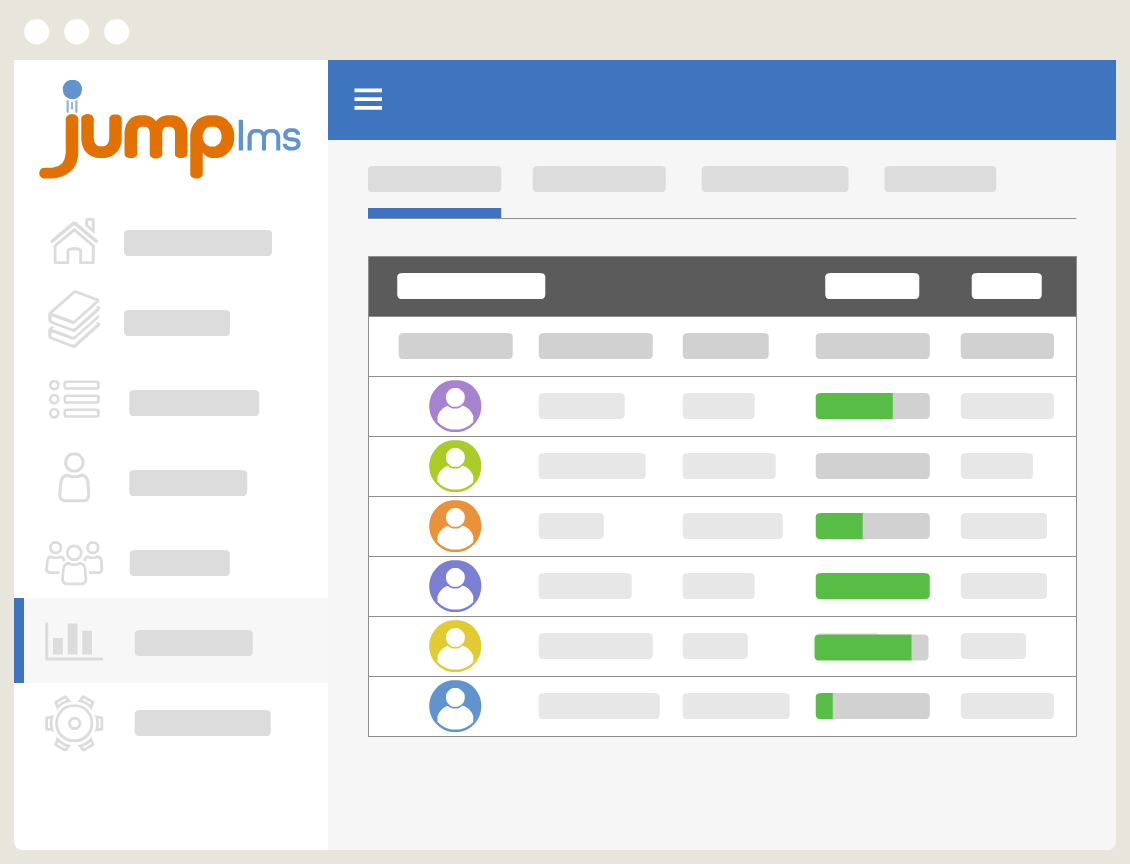
See total courses assigned, completed, time spent training, and points earned. Filter by learner name, group, or admin level.
Learner Overview
Analyse performance graphs to track progress through assigned courses.
Learner Course Progress
Zoom into an individual’s course journey, with data on both overall progress and detailed activity by course element.
Learner Timeline
Track exactly what a learner has done and when - logins, course completions, and other key training milestones.

Timeline
The platform-wide Timeline tool shows you all activity across your JumpLMS account. Use filters to isolate key events by date range, user, or activity type - perfect for auditing or analysing training habits.

